2010 - Transplantomics and Biomarkers in Transplantation
This page contains exclusive content for the member of the following sections: TTS. Log in to view.
MINI-ORAL PRESENTATIONS
4.4 - ASSESSMENT OF KIDNEY ORGAN QUALITY AND OUTCOME...
Presenter: Thomas, Mueller, Calgary, Canada
Authors: Thomas Mueller, Motaz Obeidat, Gordon Broderick, Wenjie Wang, Phillip Halloran, Valerie Luyckx
ASSESSMENT OF KIDNEY ORGAN QUALITY AND OUTCOME USING THE TRANSCRIPTOME OF THE IMPLANT BIOPSY
Thomas Mueller1, Motaz Obeidat1, Gordon Broderick1, Wenjie Wang2, Phillip Halloran1, Valerie Luyckx1. 1Division of Nephrology and Immunology, Department of Medicine, University of Alberta, Edmonton, AB, Canada; 2Division of Nephrology, Department of Medicine, University of Calgary, Calgary, AB, Canada.
Robust prediction of early and late kidney transplant function using clinical and/or pathology based markers available at time of transplantation has not been achieved. Transcriptome studies are promising but the identification of predictive genes needs reliable reference markers.
Our goal is to utilize objective measures of transplant function to refine transcriptome analysis and identify gene sets that characterize organ quality and predict early and long-term kidney function.
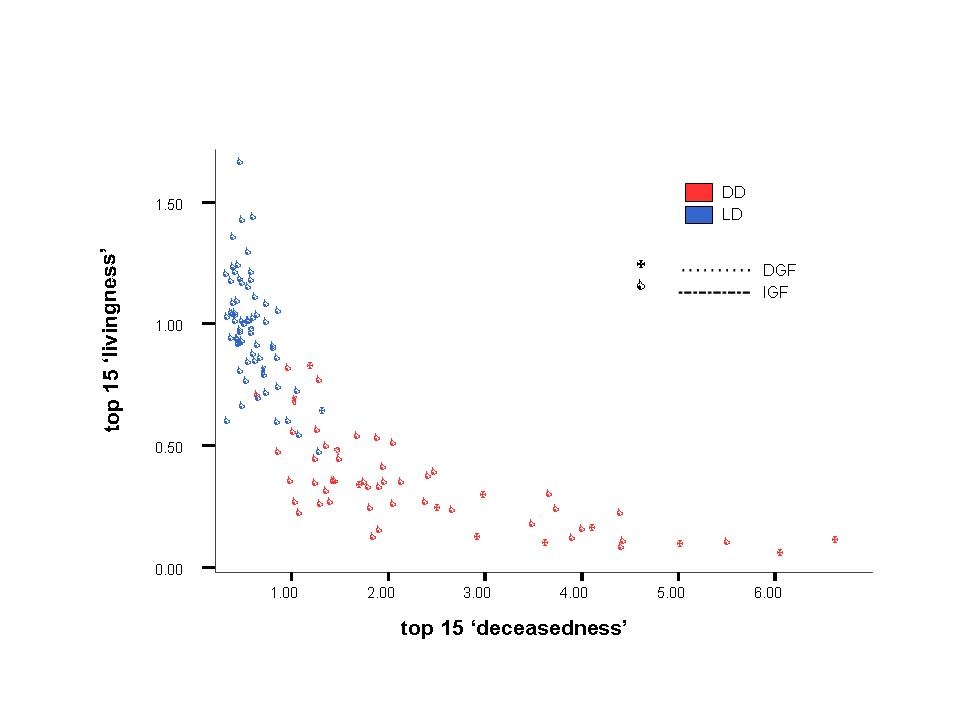
Unsupervised microarray analysis was performed on implantation biopsies taken post-reperfusion in deceased (DD) and living donor (LD) kidneys (test set: 42 DD, 45 LD; validation set: 25 DD, 39 LD). A ‘livingness’ vs. ‘deceasedness’ gene set, reflecting an individual kidney’s similarity to best functioning LD kidneys or worst functioning DD kidneys, was derived from genes overlapping between those differentially expressed among LD vs. DD and low vs. high risk for delayed graft function,
as scores of organ quality. Early function was measured by isotope scans on post-operative days 1 or 2.
In the test set, 3718 genes differentiated LD vs DD, 1051 differentiated low vs. high risk kidneys (adj p<0.01, 676 genes overlapped between these two sets. Kidneys were plotted according to individual expression of the 15 highest, ‘livingness’, and 15 lowest, ‘deceasedness’, expressed genes within this set. Kidneys were strongly separated into those with best and worst early function. When applied to our validation set the same genes again demonstrated a continuum from best functioning to worst functioning kidneys (Figure 1).
This data demonstrates that the closer a DD is to an LD kidney the better its function, and conversely the closer an LD is to a DD kidney, the worse its function. Prospectively the coordinates of an individual kidney plotted on this graph may reflect organ quality and permit prediction of utility of an organ for transplantation.
Important Disclaimer
By viewing the material on this site you understand and accept that:
- The opinions and statements expressed on this site reflect the views of the author or authors and do not necessarily reflect those of The Transplantation Society and/or its Sections.
- The hosting of material on The Transplantation Society site does not signify endorsement of this material by The Transplantation Society and/or its Sections.
- The material is solely for educational purposes for qualified health care professionals.
- The Transplantation Society and/or its Sections are not liable for any decision made or action taken based on the information contained in the material on this site.
- The information cannot be used as a substitute for professional care.
- The information does not represent a standard of care.
- No physician-patient relationship is being established.
Contact
Address
The Transplantation Society
International Headquarters
740 Notre-Dame Ouest
Suite 1245
Montréal, QC, H3C 3X6
Canada